 Precision Financial Calculator Precision Financial Calculator
Multiple Cash Flows Import
At the beginning, you are required to enter the cash flow data and highlight the range to obtain the financial evaluation parameters. You might want to use copy-and-paste to save your typing time. However, you still need to do the calculations case by case.
Now Precision allows you to import cash flow data from Excel multiple
worksheets. The Excel worksheet must contain the cash flows data in the same
cell range on each sheet. You might have worksheets already. Go to
the Worksheets Import tab and pick up a valid Excel file by clicking the Browse
button or just enter the full path name of your Excel file. Tell Precision the
location of the cash flow data range on each worksheet. These are the two required
fields you need to fill in. Others are default values if you do not specify
your values. Now you are ready to read the multiple cash flow sets, calculate
and display all the results on the Summary table. Note the Summary table
will be rewritten to reflect the new calculations.
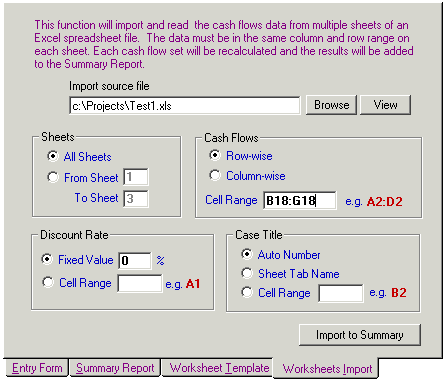
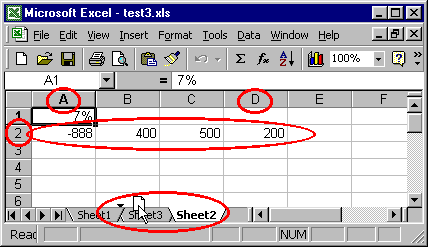
Once the file is specified or selected, the View button is enabled. You can click this button to open the Excel file to view it. You are able to view or even edit the Excel file contents. You can also rearrange the sheet tab order. After your changes, save the Excel file. Precision imports the most recent contents of the file. The cash flows data in the worksheet can be row-wise or column-wise. Select one from the radio buttons and enter the corresponding cell range. For the following worksheet, the cash flows is row-wise with cell range A2:D2.
You may type in the discount rate for all cases. Or, you may select the discount rate cell range on each sheet. The above screenshot shows the discount rate cell is A1. If you select the case title to be Auto Number, the case titles appear on the Summary Report will be Case 1, Case 2, etc.
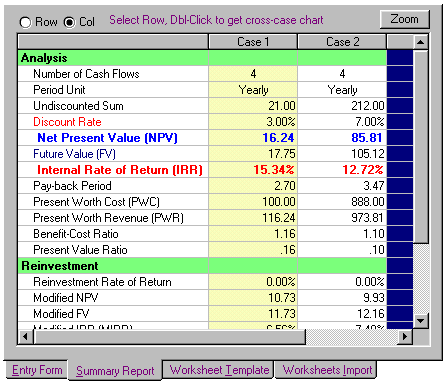
Output to Summary Report
Click the Import to Summary button then you will get a revised Summary
Report to reflect the new data from the Excel file. Precision calculates
all scenarios in seconds! Starting from here you can compare the NPV, IRR
and all other parameters.
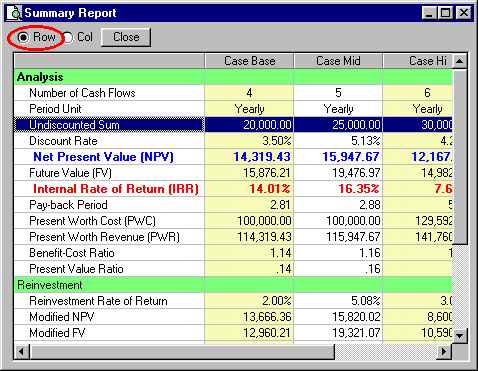
Cross-case comparisons
On the Summary Report tab, select Zoom to go to a resizable window to have a better view on cross-case comparisons. Select Row mode and double-click on any applicable row to get instant chart view
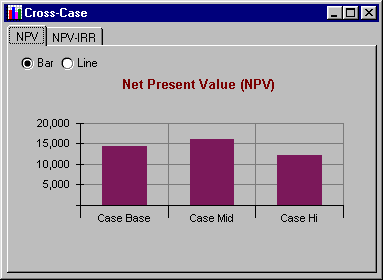
Instant Comparison Chart on any financial parameter