 Precision Financial Calculator
 Precision Financial Calculator
Project Evaluation Worksheet
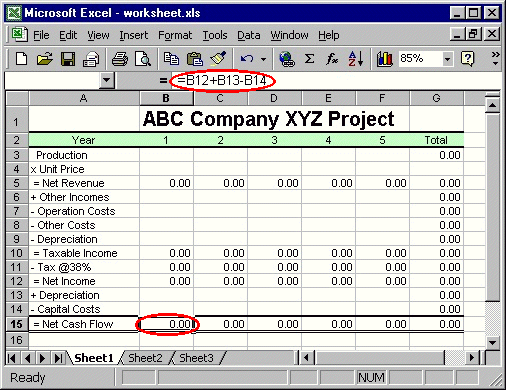
Precision provides you with a convenient Excel worksheet template for your project economic evaluations. The cell formulas are preset, so you only need to enter your own data. You will be amazed that after entering the data, the worksheet calculates the net cash flows instantly at the end row. Then use the Paste Transpose function in the Cash Flow window, you are able to copy the net cash flow data result and paste it to the cash flow grid. Before, a single DCFROR analysis takes several hours to complete. Now using Precision you can analyze a dozen portfolios within a few minutes.

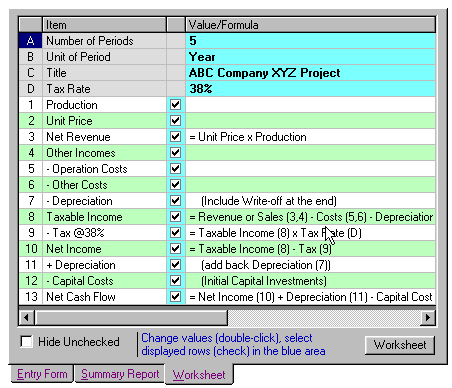
Go to the Worksheet tab and double-click or highlight the values of the cells in the blue area and change the project duration, period unit, project title and the assumed income tax rate. Select the item lines you need for your project. Then click the Worksheet button at the lower right-hand corner. If you have Excel installed on your system, Precision starts up Excel and exports a template worksheet to it. Remember, you can always change the values and the formulas from Excel.
The worksheet shown above is for the manufacturing industry. If your project is not in this category, delete the Production and Unit Price lines from the Excel worksheet. Or, uncheck these two items on the worksheet design window. Note the preset formula for each cell. Again, you can modify the titles, cell values and cell formulas at any time. You may want to paste the depreciation data from Precision's Depreciation Calculator to the Depreciation line item here. The depreciation data is to calculate the taxes. On line 13, you need to add back the depreciation to reflect the actual cash flow. The formulas do the job for you. However, to complete the calculations, you need to have some background about the depreciation, tax and all other finance related knowledge.

Generated formulas-enbeded Worksheet Template

Copy Cash Flow data
Now select and highlight the Net Cash Flow line items (do not include the Total column at the end) and right mouse click to select Copy function.

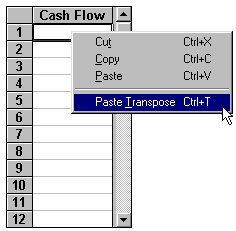
To paste cash flow data, go to cash flow grid, click on the first cell, right-mouse click to pop-up the menu and then select Paste Transpose from the menu (because you want to transpose the data from horizontal to vertical).

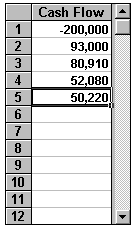
After pasting the data to the cash flow grid, highlight the cash flow range then you will automatically get all the financial analytic results. Copy and paste data just saves your typing time. Go back to Excel to change the cell data and do the same procedures again to get another case. Before doing this, add each scenario to Summary for later cross-case comparisons. Note you can also do the Exact Date Cash Flow analysis by copying and pasting the cash flow data and the date data separately. In the Examples section, you will see a complicated project DCFROR economic evaluation example. Make your own assumptions and use this template to calculate the financial parameters of every case.